
Stataのグラフになくてはならない色の参照図.
これを画面で開いておくか、どこかに貼り付けておけば色の選択で迷う必要はもうありません.
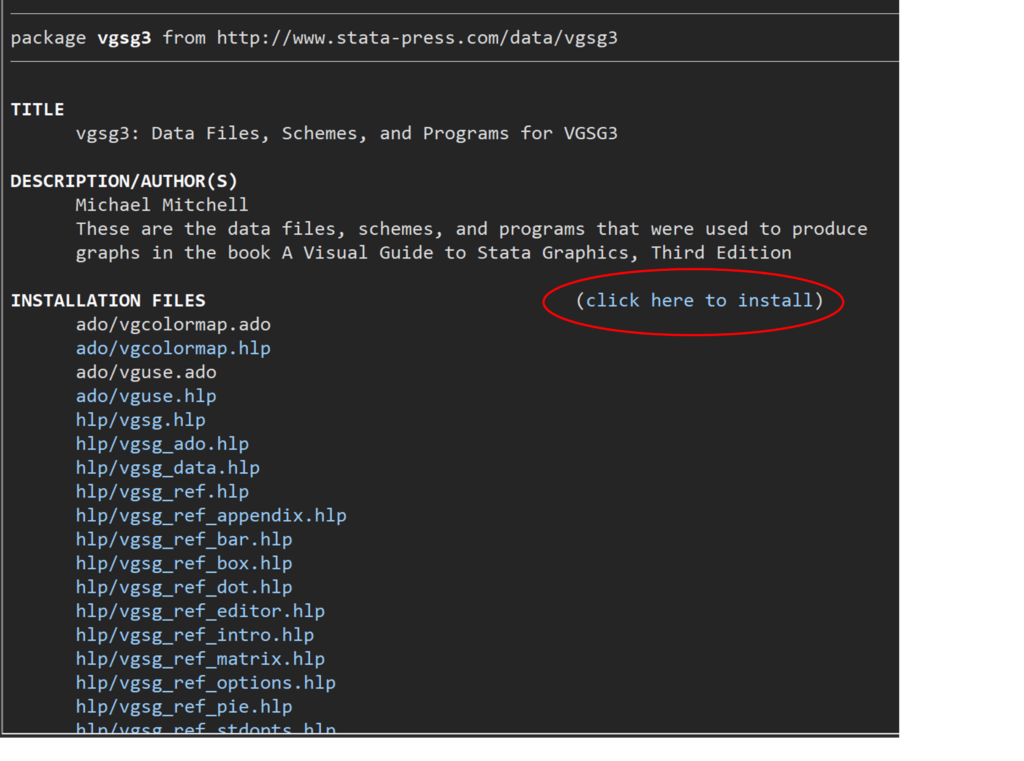
Stataのコマンドラインに下記を入力してください.
net from http://www.stata-press.com/data/vgsg3/すると次のような画面が結果に表れるはずです↓

ここをクリックしたあとで現れる別のウィンドー(Help画面) ↓
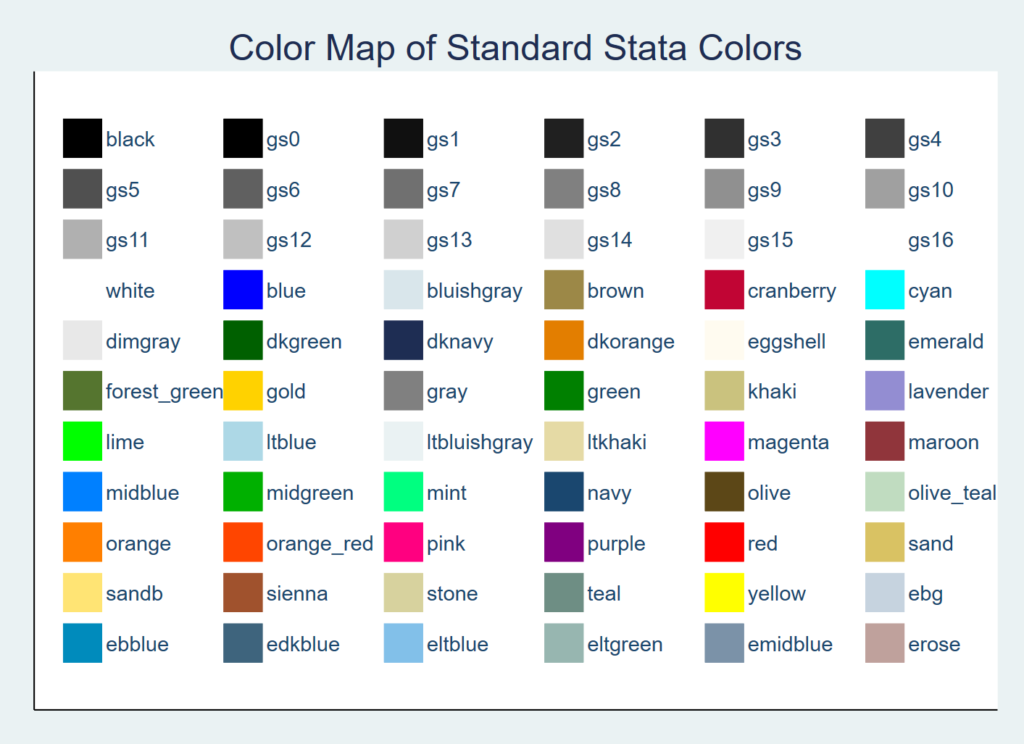
そして最後に
. vgcolormap
とコマンドラインに入力するだけでこのようなカラーパレットが得られます↓
お好みに応じてこちらもオススメ↓
ssc install hue
hue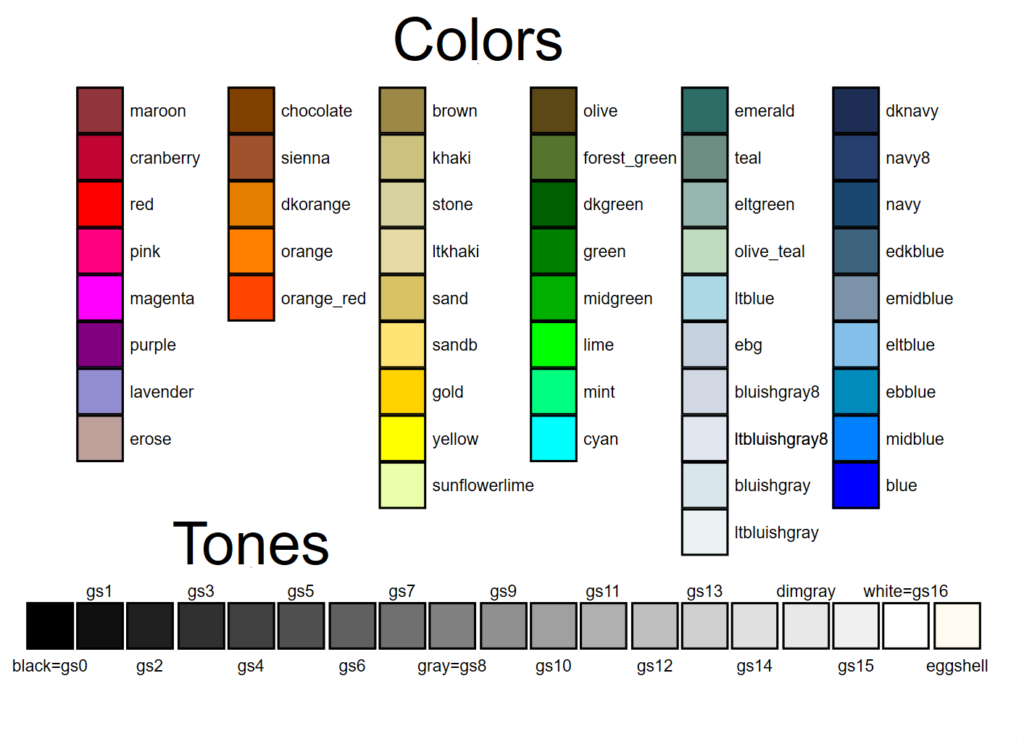
Stataグラフ作成時にお役立てください.

コメント